Terraviis Group · Market Note · July 2026 The first 2026/27 forecasts landed in June, and they do not tell one story. Wheat, maize and rice are heading lower. Soybeans are heading for a record. Headline food prices look calm while the components underneath move in opposite directions. And freight has become the number most …
Terraviis Group · Market Note · July 2026
The first 2026/27 forecasts landed in June, and they do not tell one story. Wheat, maize and rice are heading lower. Soybeans are heading for a record. Headline food prices look calm while the components underneath move in opposite directions. And freight has become the number most likely to be wrong in any calculation older than a few weeks.
Here is what the June data says, and what it means for Q3 procurement.
One season, several markets
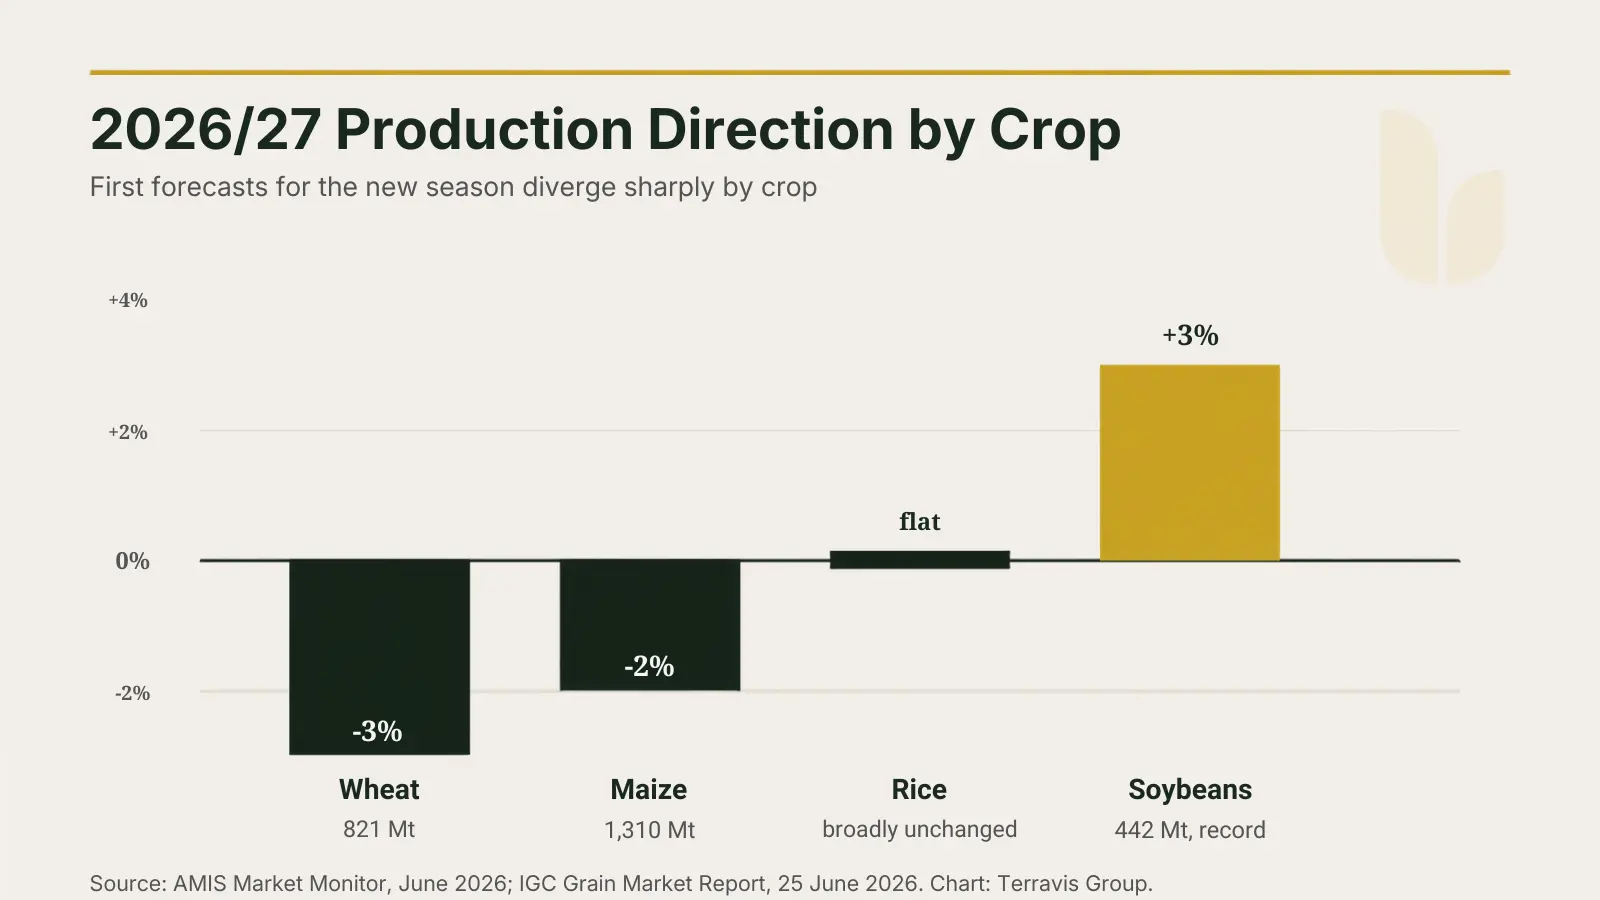
The June 2026 AMIS Market Monitor carries the first forecasts for the new marketing year: less wheat, less maize, less rice, and a new soybean record. The IGC’s Grain Market Report of 25 June puts 2026/27 total grains at 2,426 million tonnes, 2 percent under this season’s record and the first annual decline in four years. End-season stocks are seen tightening to 618 million tonnes.
Prices are just as split. FAO’s May Food Price Index came in at 130.8 points, essentially flat on April. Look inside the number and it stops being flat: cereals rose 2.6 percent to their highest since June 2024, vegetable oils dropped 4.6 percent, rice firmed. If you buy grain, your market got more expensive in May. If you buy oils, it got cheaper. The headline index tells you neither.
Crop by crop
Wheat
The IGC has 2026/27 world production at 821 million tonnes, down 3 percent. FAO noted in early June that world wheat prices had risen for a fourth straight month on smaller expected harvests in several major exporters, with fuel and fertilizer costs adding pressure. USDA’s June WASDE sees US ending stocks 20 percent below last year. What keeps the balance workable is heavy supply from several producing regions. Tighter, yes. Tight, not yet.
Maize
1,310 million tonnes in the IGC’s June report, down 2 percent. USDA expects global corn stocks to fall around 7 percent in 2026/27 as consumption keeps growing. Spot values actually eased in recent weeks because near-term supply is comfortable. The tightening here is a 2027 story, not a July one.
Rice
Rice went its own way. The IGC recorded a 5.4 percent monthly rise in rice prices while wheat, maize and soybeans all fell, and FAO’s All Rice Price Index added 2.7 percent in May. The IGC sees 2027 rice trade at a record 62 million tonnes on African demand, and flags a strengthening El Niño as the main risk to Asian yields.
Soybeans and oilseeds
Soybeans are the clearest supply outlier. The IGC expects a record 2026/27 crop of 442 million tonnes, up 3 percent, with trade and consumption also at new highs. That supply weight helped pull FAO’s Vegetable Oil Price Index down 4.6 percent in May, its first decline of 2026. Sunflower oil stayed firm on tight supply, so even here the picture is not uniform.
Trade is holding up. Cost assumptions are not.
Volumes have moved better than the cost environment would suggest. AMIS counted record combined wheat, maize and soybean exports between March and May 2026, despite freight volatility and higher logistics costs. The same AMIS analysis makes a quieter point that matters more for buyers: the freight share in landed grain costs has climbed roughly 2 to 3 percentage points, and that shift has been driving delivered prices up.
Inputs are the second pressure. The World Bank’s April Commodity Markets Outlook has energy up 24 percent and fertilizer up 31 percent for 2026, led by urea. Fertilizer affordability feeds straight into next season’s planting and yield math. Worth noting: the Bank’s May monthly data showed both energy and fertilizer easing month on month. Cost pressure is real, but it is not moving in one direction only.
Freight: rework your Q3 planning assumptions
Container rates are moving fast. Drewry’s World Container Index rose 9 percent to USD 4,530 per 40ft container in the week of 2 July, its highest level since September 2024. Freightos recorded increases across the main Asia outbound lanes in late June. Carriers have announced general rate increases and peak-season surcharges for July, and cancelled sailings on the main East-West trades are running near 3 percent, which tells you demand is firm and space is tight.
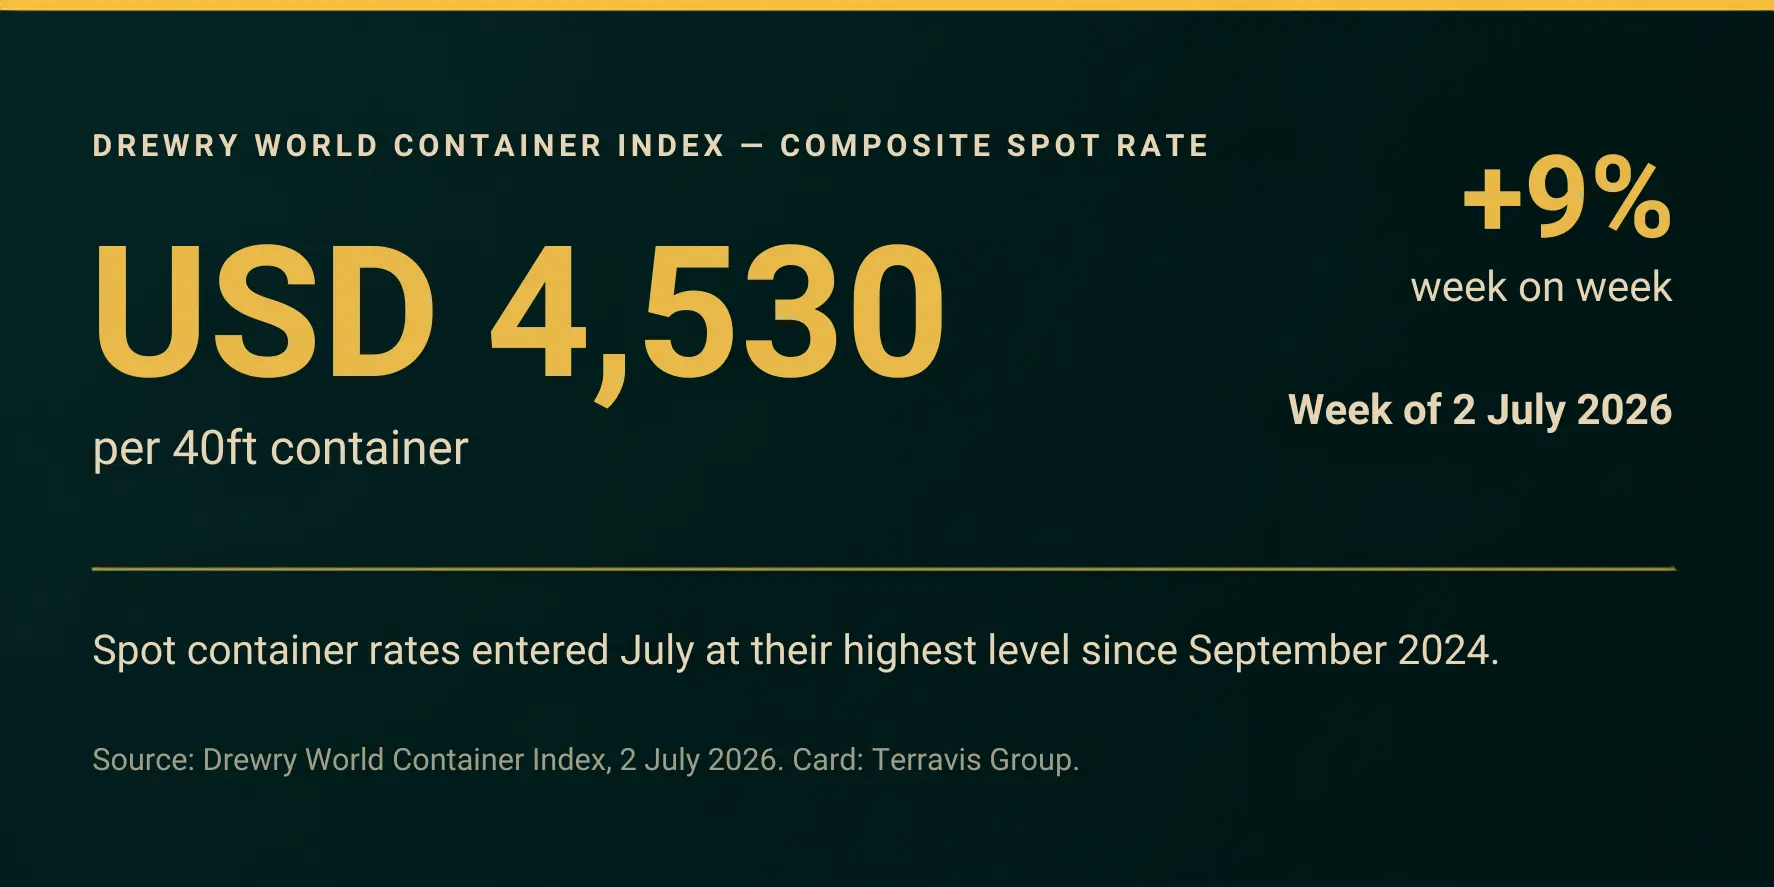
Put simply: a delivered-cost figure built on May or early-June freight is already wrong.
What to do with this
Confirm freight at booking, not from a quote made three weeks ago. Treat every delivered-price indication as valid only for its stated window. Lock specifications, documentation requirements and quality-control parameters at quotation stage rather than after contract, because export and import requirements in several markets are changing faster than usual. Where destination rules call for independent inspection or laboratory testing, build it into the shipment timeline from day one; our overview of food safety and inspection procedures explains how this is coordinated in practice.
And plan Q3 and Q4 by product, not by headline index. Grain, rice and oilseeds have stopped moving together.
From our desk
Terraviis Group manages agricultural supply flows from origin to destination: procurement, processing, quality verification, documentation and logistics for B2B buyers. You can read more about our agri-product sourcing and export operations. Seasons like this one reward discipline over prediction, and we would rather send you a current, accurate quotation than a fast, stale one. If you are building 2026/27 programmes, ask us for current specifications and quotation basis for your product categories. Commercial terms, including delivery basis, are confirmed at quotation stage against the market as it stands that week.
Sources
- AMIS Market Monitor, June 2026 edition; May 2026 edition No. 138 — amis-outlook.org/market-monitor
- FAO Food Price Index, released 5 June 2026 (May 2026 data) — fao.org/worldfoodsituation/foodpricesindex/en
- IGC Grain Market Report, 25 June 2026 — igc.int
- USDA WASDE, June 2026 — usda.gov/oce/commodity/wasde
- World Bank Commodity Markets Outlook, 28 April 2026; Commodity Price Data, 2 June 2026 — worldbank.org/en/research/commodity-markets
- Drewry World Container Index, 2 July 2026 — drewry.co.uk
- Freightos FBX Weekly Update, 30 June 2026 — freightos.com
This market note is for general market information only and does not constitute a price offer, availability confirmation, route commitment, or commercial quotation.